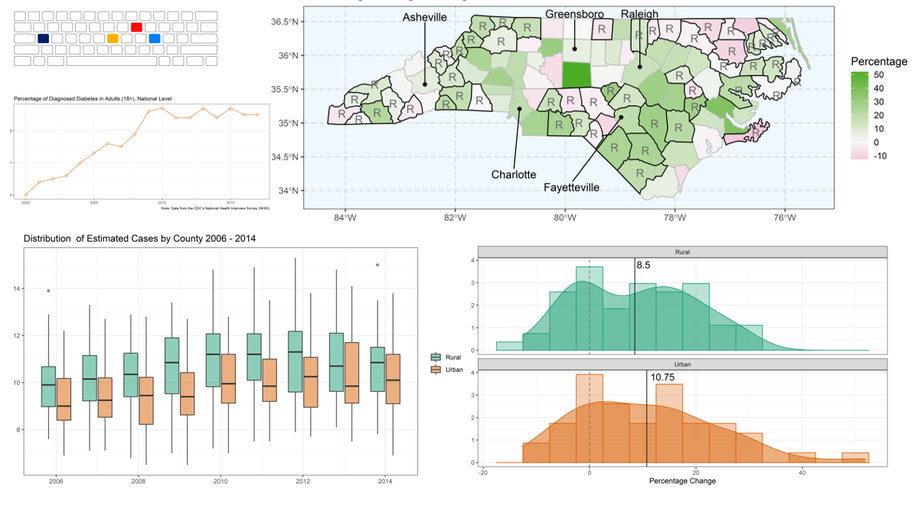
Diabetes in Rural North Carolina
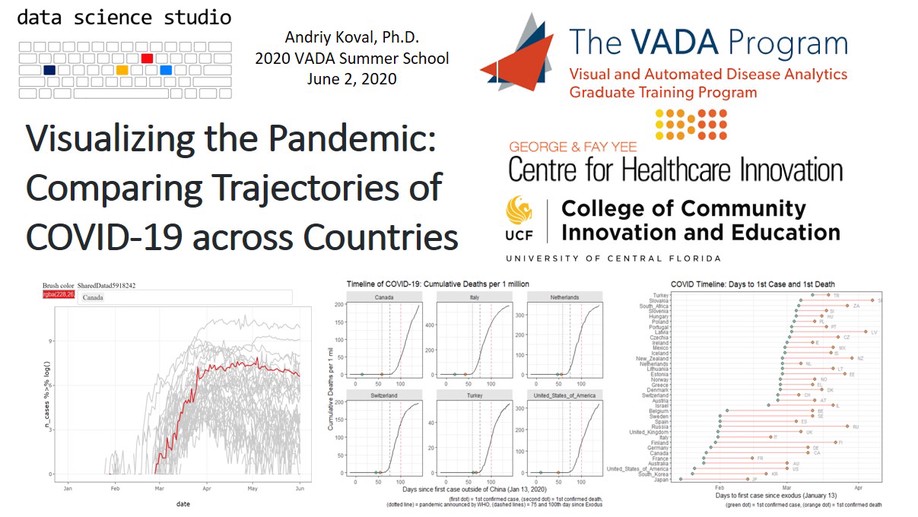
Visualizing the Pandemic
plotly::ggplotly(), 2) compute relative timelines for each country and 3) plot sequence of key events for cross-country comparison.
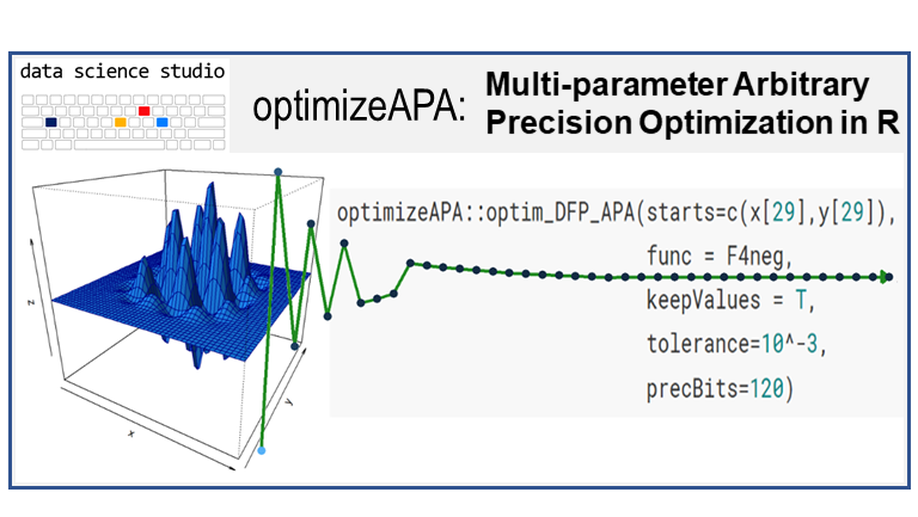
Arbitrary Precision Optimization in R
optimizeAPA is an R package which allows for multi-parameter optimization. That means you can use it to find the maximum (or the minimum) value of a function with many input values. What makes optimizeAPA unique? It works with arbitrary precision arithmetic.

ASGR: 2.2 - Joining Data
Out in the real world you may often find yourself working with data from multiple sources. It will probably be stored in separate files and you’ll need to combine them before you can attempt to answer any of your research questions. Click here to learn how you can combine data frames using a set of dplyr functions called joins.
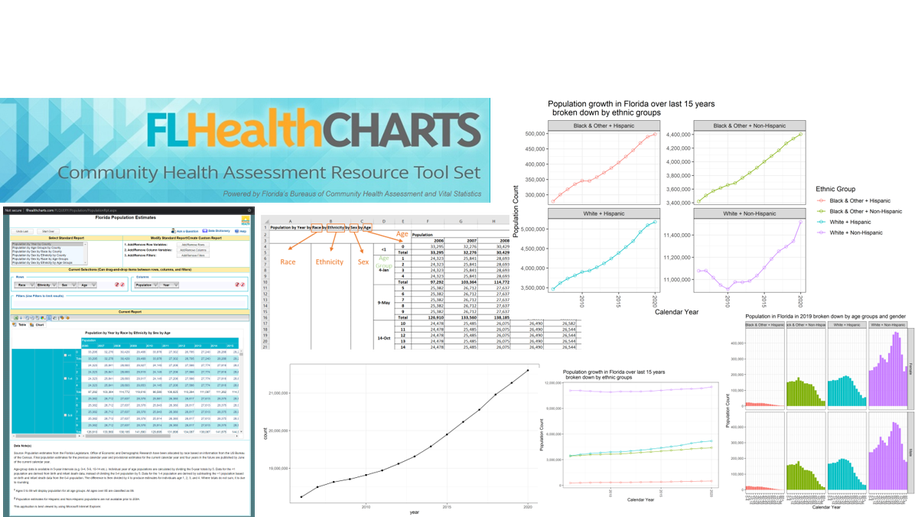
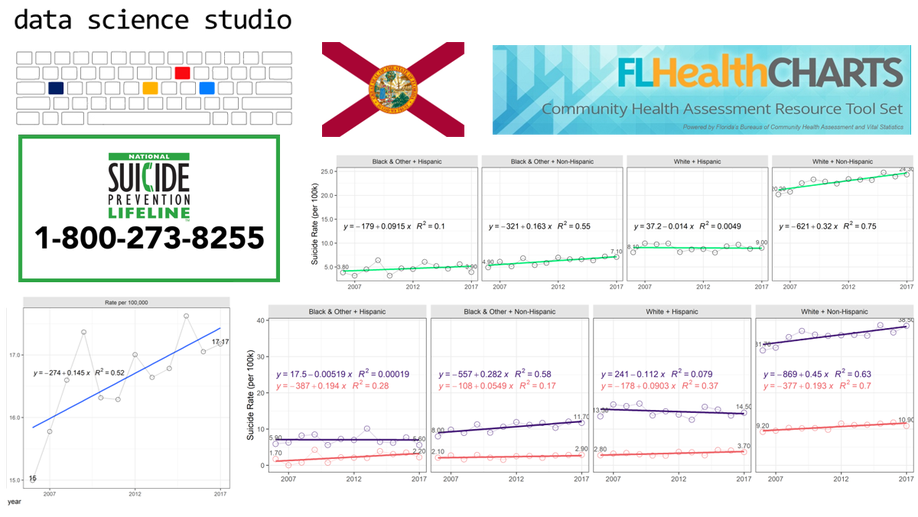
Florida Demographic Growth
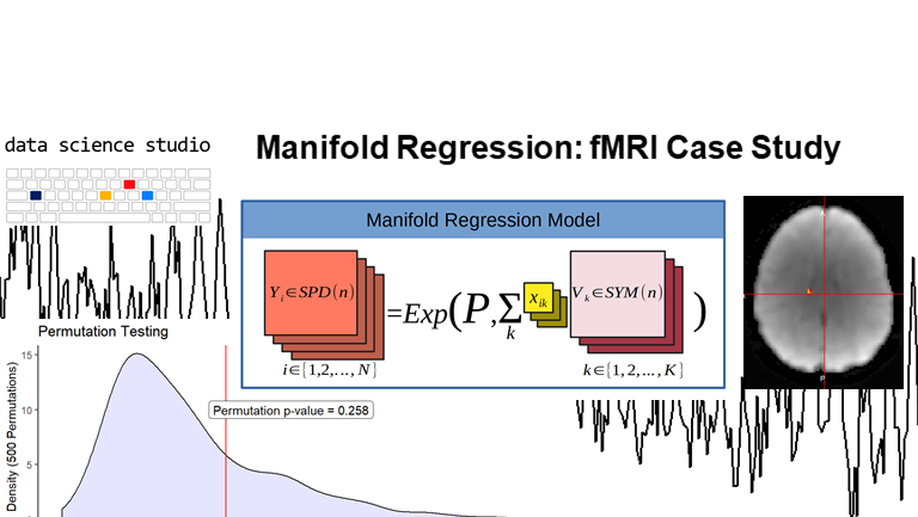
Manifold Regression (part 2)
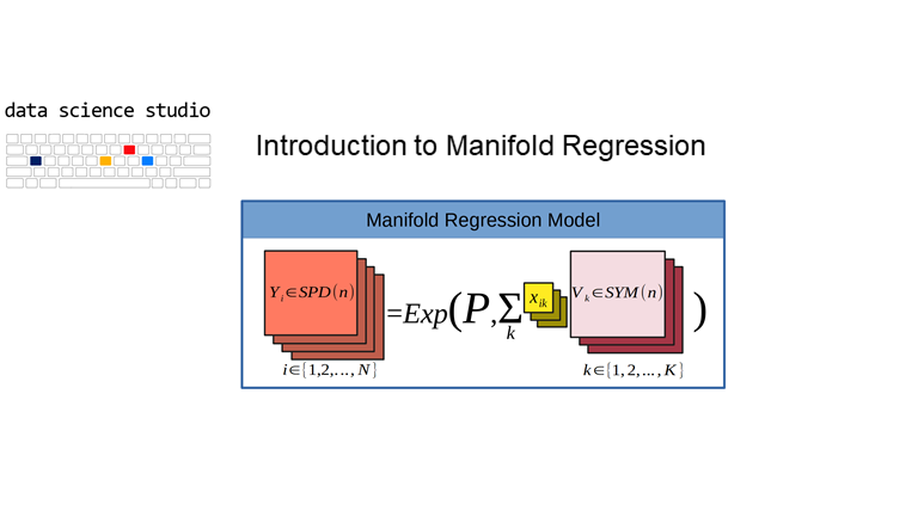
Manifold Regression (part 1)
Welcome to the world of manifold regression! In part 1 we will introduce the basic concepts, overview the theory behind regression on manifolds, develop an intuition for these models, and discuss their applications.

ASGR: 2.1 - Data Transformation - Part 1
The 4th post in the Scientist’s Guide to R series introduces data transformation techniques useful for wrangling/tidying/cleaning data. Specifically, we will be learning how to use the 6 core functions (and a few others) from the popular dplyr package, perform similar operations in base R, and chain operations with the pipe operator (%>%) to streamline the process. Click here for the full post.