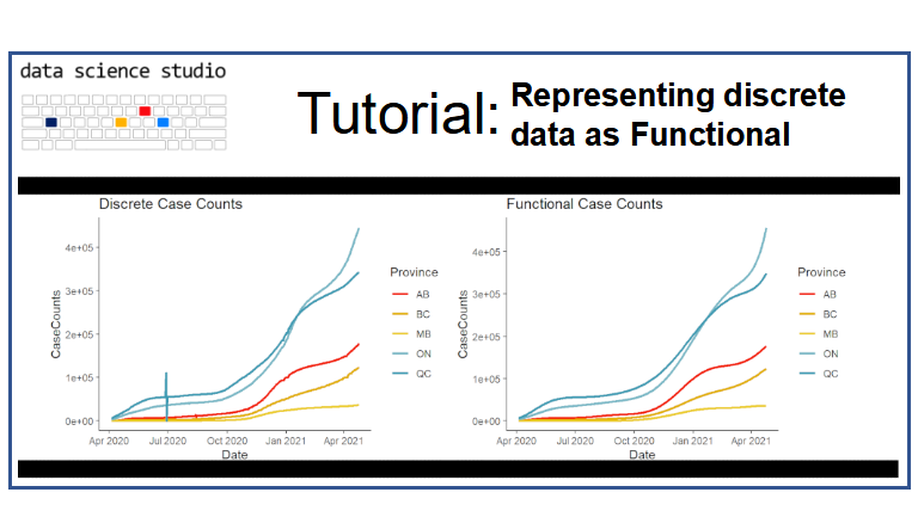
Functional Data Analysis: Discrete Observations to Functional Representations
ASGR: 3.0 - exploring data with elucidate
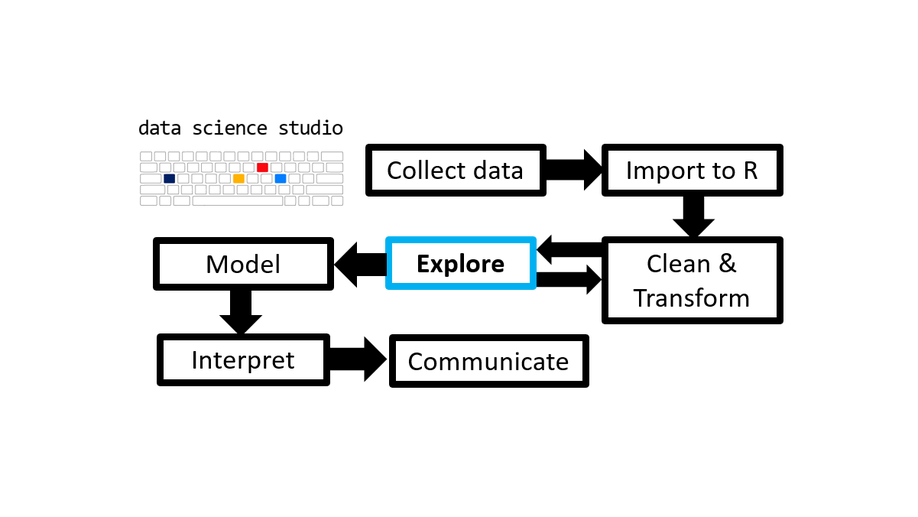
This post dives into the elucidate package and how it can help you explore data using sets of functions for interrogating, describing, visualising, interacting with, and correcting data. This is a key stage of any analysis where errors are found and interesting relationships begin to appear. Click here for the full post.
Power Tips - November 2020

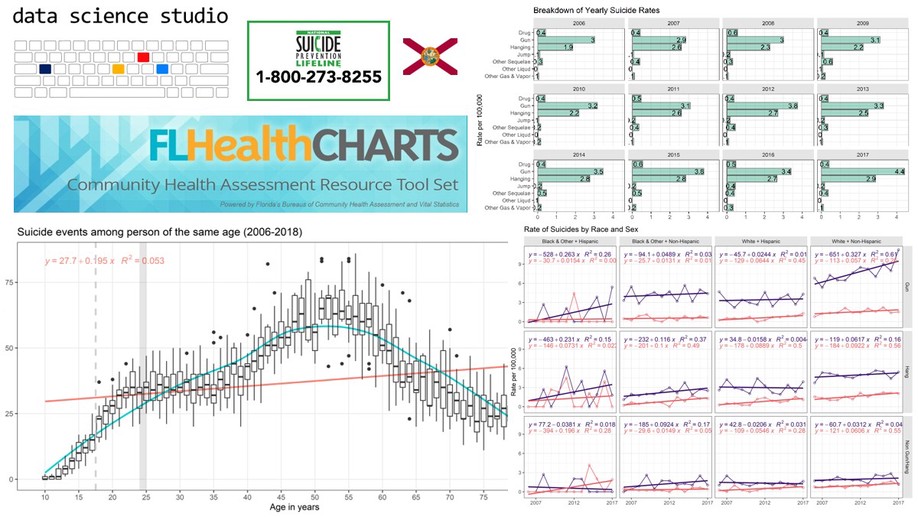
Florida Suicides (2) - Youth Trends
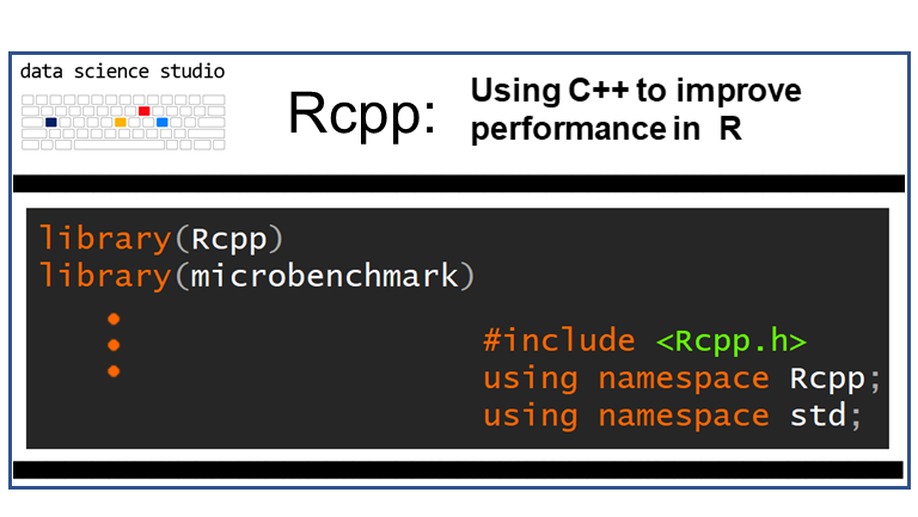
Rcpp: Using C++ to improve performance in R
Rcpp is an R library allowing for easy integration of C++ code in your R workflow. It allows you to create optimized functions for when R just isn’t fast enough. It can also be used as a bridge between R and C++ giving you the ability to access the existing C++ libraries. Continue reading to learn how you can use Rcpp in your projects!

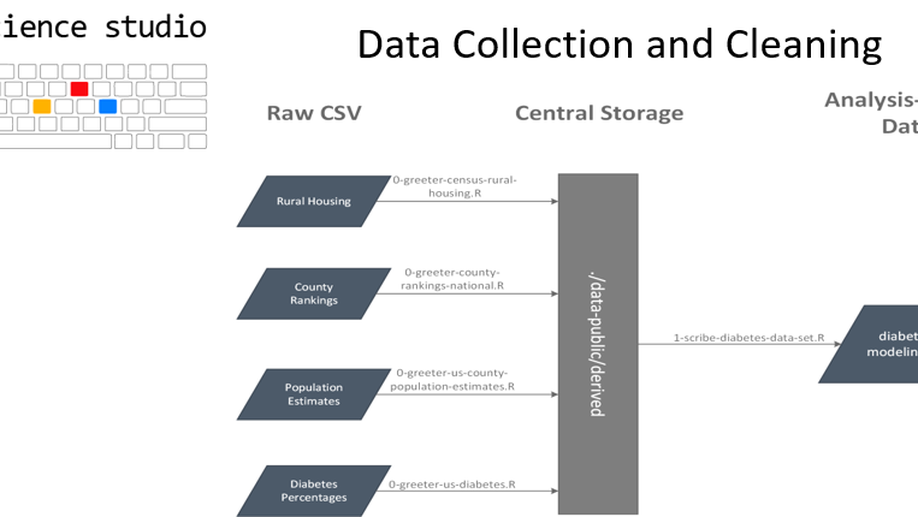
Diabetes in Rural North Carolina
Summary
Diabetes is growing at an epidemic rate in the United States. In North Carolina alone, diabetes and prediabetes cost an estimated $10.9 billion each year (American Diabetes Association, 2015). This is the second post in the series exploring Diabetes in rural North Carolina. This post will explore the data used for this project, from collection, cleaning, and analysis ready data.
Please read the full post here
ASGR: 2.3 - strings
Being able to work with character strings is an essential skill in data analysis and science. In this post we’ll learn a few of the ways in which the stringr package and regular expressions (AKA “regex” or “regexps”) makes working with strings in R considerably easier. Click here to read the full post.
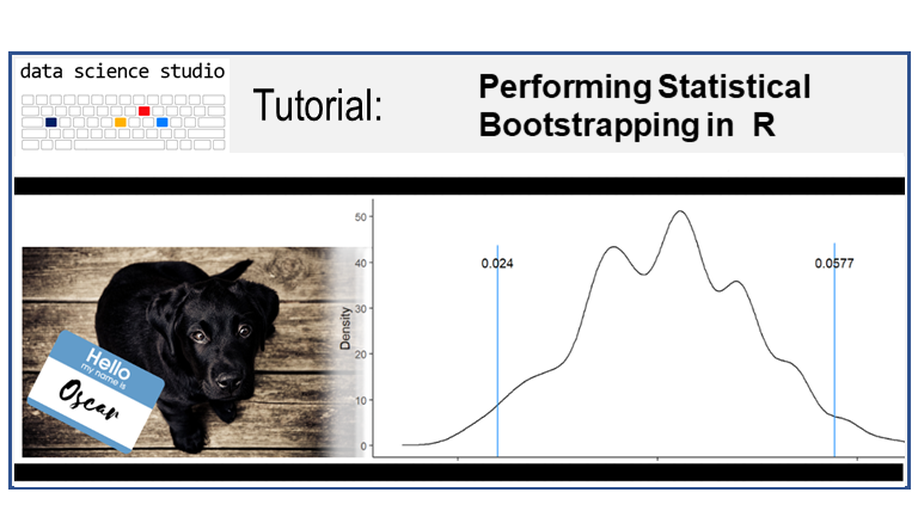
Bootstrapping in R
Bootstrapping is a statistical technique for analyzing the distributional properties of sample data (such as variability and bias). It has many uses, and is generally quite easy to implement. Continue reading to learn how you can perform a bootstrap procedure in R!