ASGR: 2.0 - basic operations and data structures
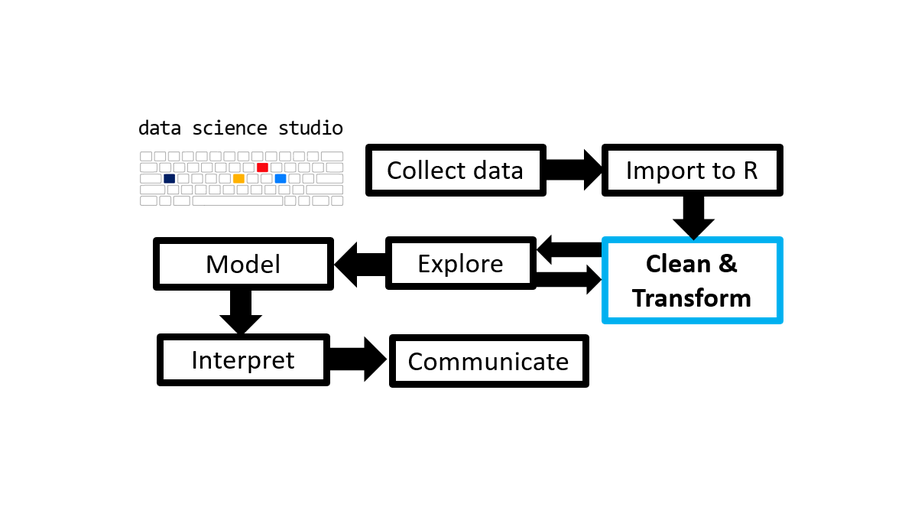
As the third post in the Scientist’s Guide to R series (click here for the 1st post), we advance to the brink of the next major stage of the data analysis with R process: cleaning and transforming data. However, before we can clean or transform anything we will need to know how to do a few basic things and familiarize ourselves with some common data structures in R, which are the topics of this post.
Categories of research
30-50 words
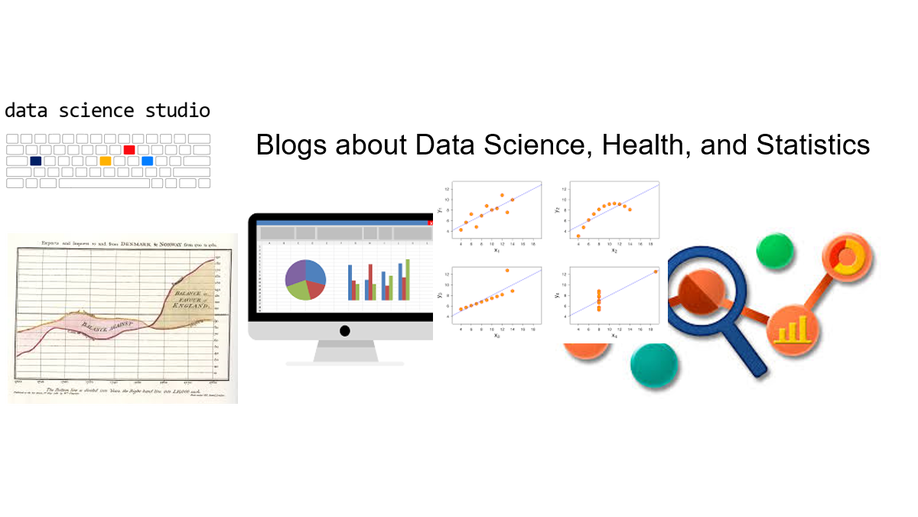
Welcome to DSS Blogs
Welcome to DSS Blogs, a peer-reviewed blogging journal about reproducible analytics, functional graphing, statistical modeling, and data visualization.
This working group also reports on the activities of the Data Science Studio at the Institute of Aging and Lifelong Health, University of Victoria. If you are interested in being featured on the DSS Blogs, please consult our How to Contribute guide detailing how you can submit your blogpost for the peer review.
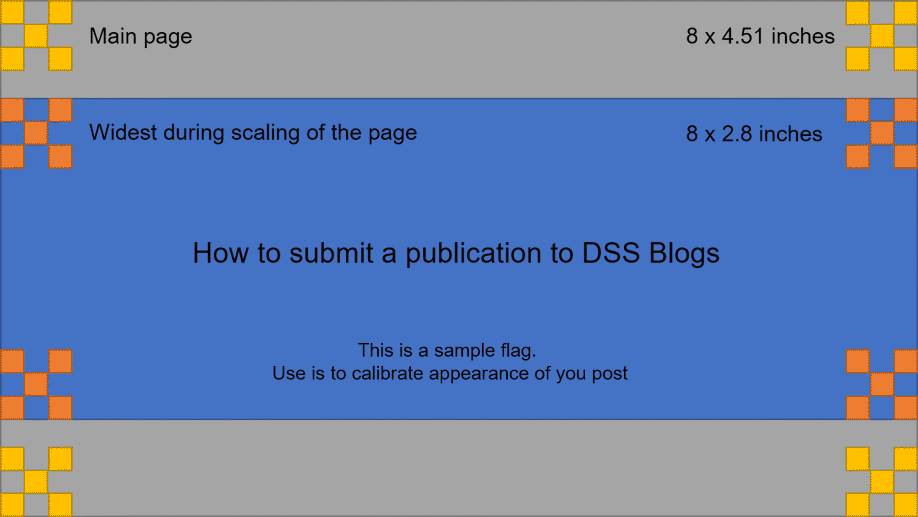
How to Contribute
This is a guide detailing how you can deploy your article to be featured on the DSS Blog. All published posts are peer reviewed by two members of the DSS editorial team. Whether you are a new member, part of the editorial team, or an Acting Admin, this guide will serve as a road map to create and promote posts on DSS Blogs. ————–
Table of Content Adding a New Post Blog Authors New Post Template Required Components Create Summary Image From Template Create Summary Text and Link Editorial Team Flagged as Reviewer Acting Admin Merge Request Adding a New Post Please note that this post assumes that you have:
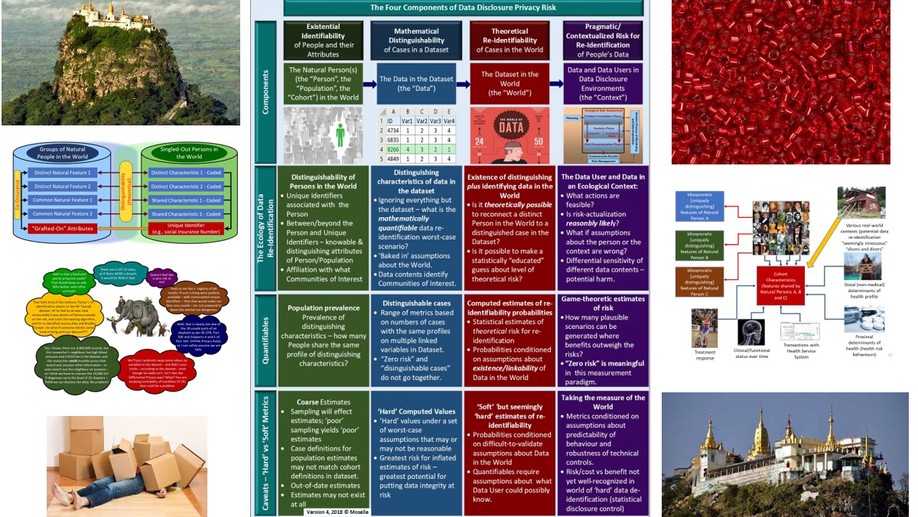
“Real-world” de-identification of linked Electronic Health Records
Linking health records is key to innovation in health care. At the same time linkage poses major challenges for disclosing patient data to researchers. The presentation proposes a methodology for structuring risk assessment of high-dimensional linked data.
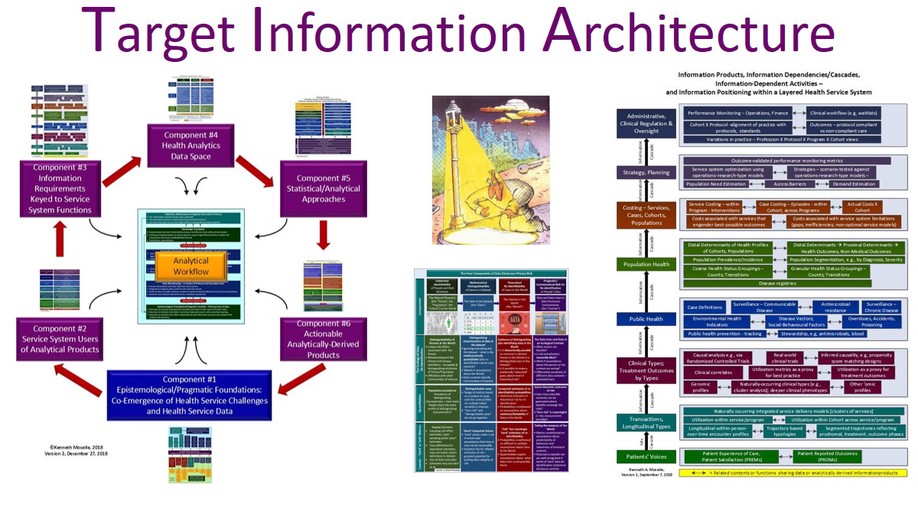
Target Information Architecture
Target Information Architecture (TIA) is an graphical rendering of answers to a series of linked questions relating to analytic products from data to support the functions performed by persons, providers or programs within a health system. We argue that a developed TIA is a necessary condition to guide the translation of health service analytics back into a health service system.
ASGR: 1 - Importing Data
The second post in the Scientist’s Guide to R series covers everything you need to know to get started with importing data from a variety of sources (.csv, .txt, .xlsx, etc) into R. Click here to read the full post.
Suppress for Release - CAHSPR, Halifax
In 2016, the Observatory for Population & Public Health of British Columbia launched the Chronic Disease Dashboard, an online reporting tool designed to address the gap in surveillance of chronic diseases. To protect against re-identification risks, the Ministry of Health required redacting small counts prior to releasing disease rates into public domain. These preparations, when conducted manually, have proven to be arduous, time consuming, and prone to human error.
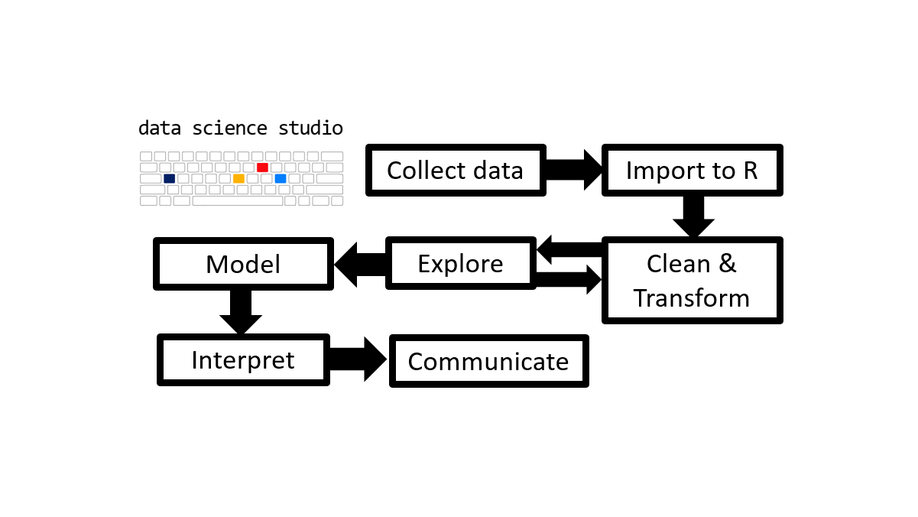
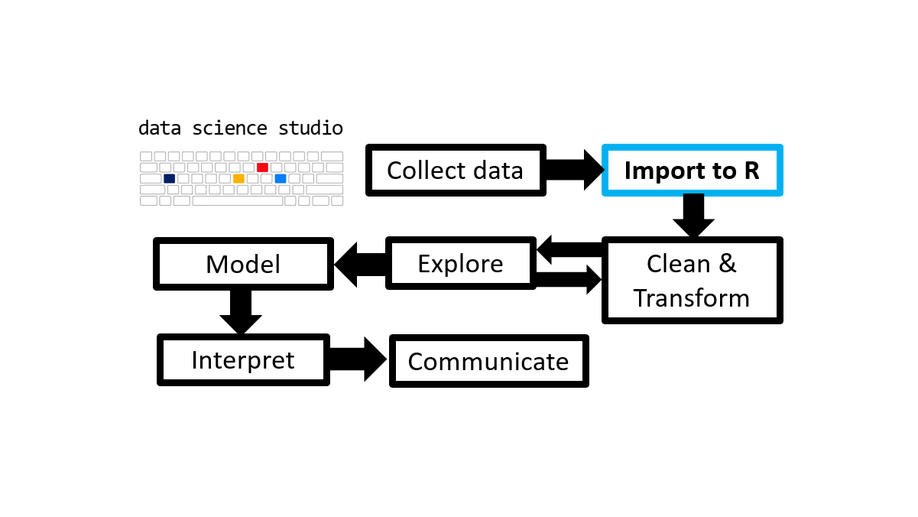
ASGR: 0 - Intro & Workflow
This tutorial will be the first of many blog posts for new researchers and science program students/trainees on how to use R as an analytical and productivity tool in the process of conducting scientific research. Click here for the full post.
The Origins of DSS
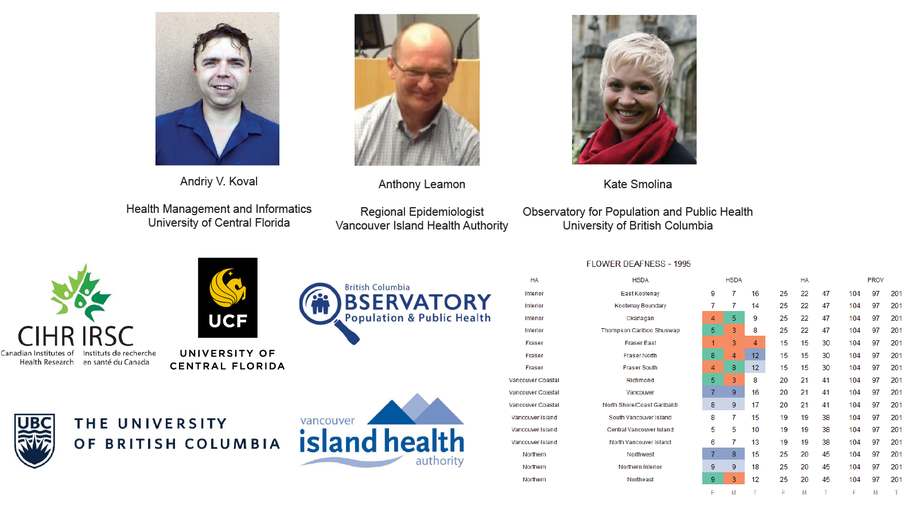
The Data Science Studio (DSS) was formed to promote sound practices of longitudinal modeling in health research and facilitate collaboration between academic researchers and health sytem organizations. This working group was conceived and launched by Ken Moselle, Scott Hofer, and Andriy Koval.
In fall 2014, Scott Hofer organized a colloquium series at the Institute on Aging and Lifelong Health - then “Centre on Aging” - with focus on reproducible methods and applications in aging research.